

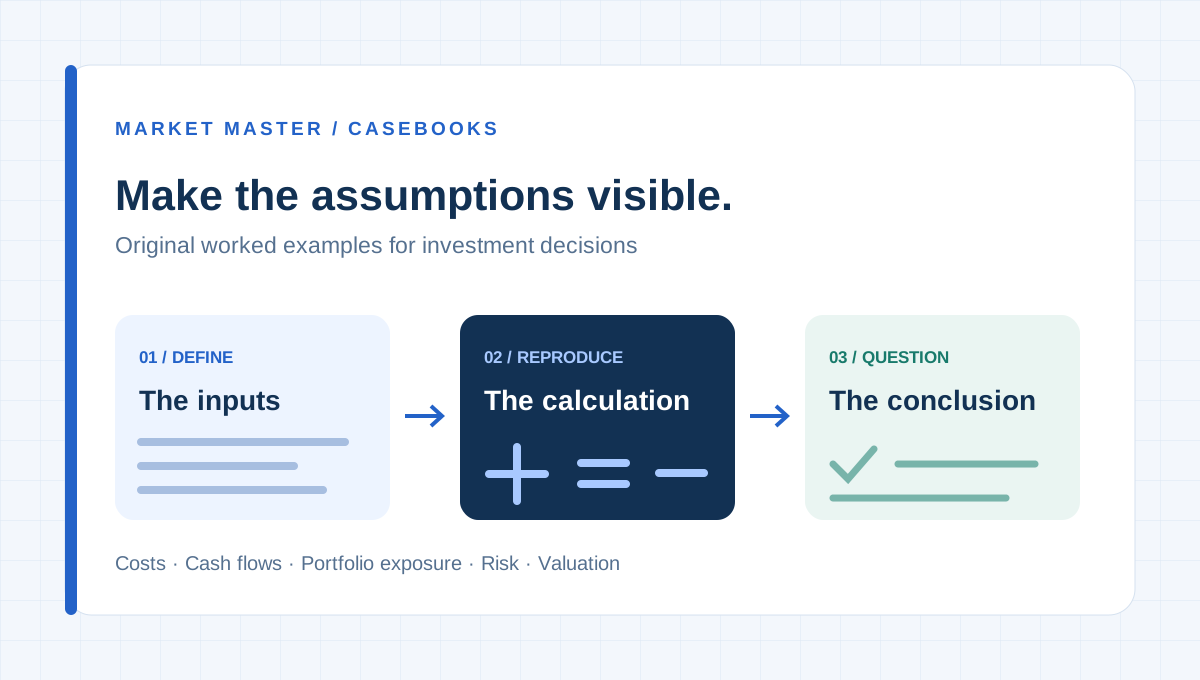
A correlation result can be mathematically correct for the rows supplied and still answer the wrong market question. Mismatched dates, duplicated observations, different currencies and inconsistent price adjustments can create apparent relationships that come from data preparation rather than the investments. The first analysis should therefore be a check of the series, not the coefficient.
This example uses fictional prices. It does not represent any security, market or trading strategy. The short series is intentionally too small to support a serious investment conclusion; its purpose is to show how one missing observation changes what a return means.
Match the interval, not just the row number
Series A has prices of 100 on Monday, 102 on Tuesday, 101 on Wednesday and 103 on Thursday. Its successive simple returns are positive 2%, approximately negative 0.9804% and approximately positive 1.9802%.
Series B has prices of 50 on Monday, 51 on Tuesday and 52 on Thursday, with Wednesday absent. Its observed Tuesday to Thursday return is approximately positive 1.9608%. That is a two session interval, while A’s Wednesday to Thursday return covers one session. Putting them in the same row merely because they are the final returns in each file would mix different periods.
If the chosen analysis uses only shared observation dates, the common dates are Monday, Tuesday and Thursday. A’s Tuesday to Thursday return is approximately positive 0.9804%, calculated from 102 to 103. B’s return over that same interval is approximately positive 1.9608%. The periods are now aligned, but they are no longer a uniform set of daily returns.
Do not create a missing price without a reason
Filling Wednesday’s missing B price with Tuesday’s 51 would produce a zero Wednesday return and place the entire observed move on Thursday. That can alter the correlation and volatility estimate. The data does not establish that the asset truly had no price movement on Wednesday.
Forward filling can have a defined role in some valuation workflows, but it is not a neutral repair for every statistical calculation. Before filling, investigate whether the absence reflects a holiday, a suspended market, a provider omission or an invalid record. Keep the original series available so the transformation can be inspected.
Dropping unmatched observations is also a choice with consequences. If omissions cluster on unusually volatile days, a complete case sample can be unrepresentative. Report the number of matched observations, the date range and the exclusions rather than showing only the final coefficient.
Use comparable price definitions
A raw close can show a discontinuity around a stock split even when the economic position has not changed in the same way. A series adjusted for splits or distributions follows a different convention. Do not compare an adjusted series with an unadjusted one and assume both returns mean the same thing.
Check the provider’s actual adjustment method. The word adjusted is not enough to establish how dividends, splits, currency changes or revisions were handled. Similarly, two assets observed at different market closing times can have a timing mismatch even when their calendar dates are identical.
Know what the statistic requires
Pearson correlation describes a linear relationship between matched observations and is bounded between negative one and positive one when defined. If either return series has zero variance, the usual denominator is zero and the coefficient is undefined. A software interface should not turn that condition into a reassuring zero correlation.
With only two nonconstant matched return observations, the coefficient can land at an extreme value without providing robust evidence about a lasting relationship. More observations do not cure incompatible definitions, and a longer sample can still miss the conditions that matter to the investor. Statistical confidence and economic relevance remain separate questions.
Make the import itself part of the research record
In the Advanced Analytics workspace, confirm the supplied CSV conventions before running the analysis. Check chronological ordering, duplicate dates, numeric parsing, currency, observation frequency and adjustment method. If the workspace declines an invalid file, correct the source or explain the transformation rather than repeatedly changing the labels until it loads.
Retain the original file and note any rows removed. Compare the first and last dates with the provider’s available period. A column named price does not establish that the values are current or licensed for a particular use. The site’s data timing explanation distinguishes observation dates from retrieval times.
Interpret the result within its scope
Even after those checks, historical correlation is not a promise about the next shock. It does not measure every form of concentration, predict a joint drawdown or establish causation. Use the combined position risk example to inspect explicit loss assumptions separately.
A useful report states the matched period, return convention, number of observations, missing data treatment and the question being tested. It should be possible for another person to recreate the coefficient from the same inputs. That reproducibility is a stronger foundation for analysis than an impressive looking number whose dates and definitions are unknown.
About this worked example
The inputs describe a fictional case, not current market quotes. The calculations and publication copy are retained in the release record. Read the assumptions and limitations in the guide before changing inputs.
Editorial responsibility
Owner-operated and evidence-led
Market Master is an independent, owner-operated publication led by Andrejus S. Guides connect financial concepts with transparent methods and practical examples. Author information, production methods and correction procedures are described in our editorial standards. Supporting references are retained in the editorial records.