

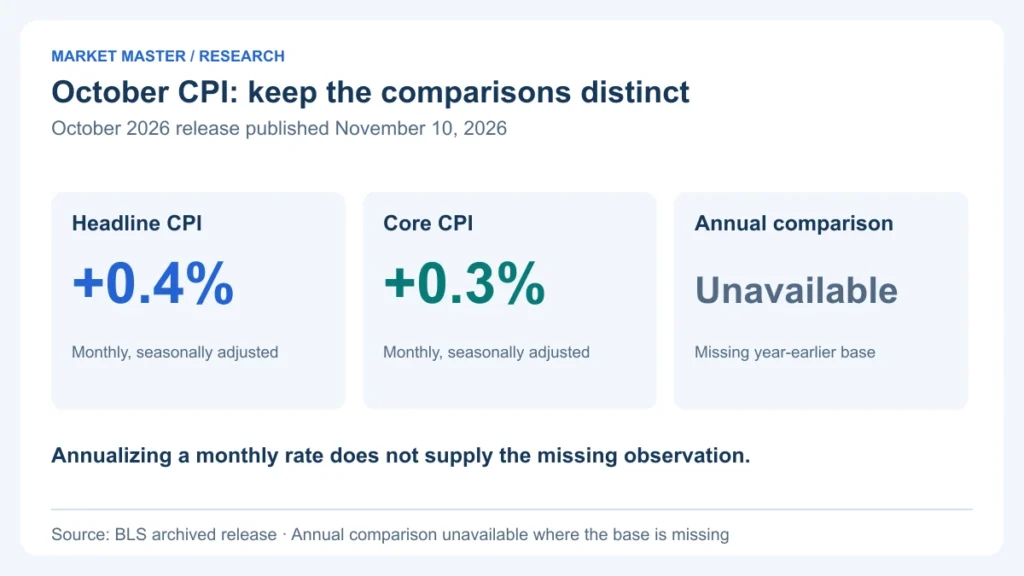
October 2026’s U.S. Consumer Price Index release contains a useful warning for anyone writing a market summary: a missing comparison should remain missing. The Bureau of Labor Statistics reported a seasonally adjusted 0.4% monthly increase in the all-items CPI-U, following 0.6% in September. It did not publish the usual twelve-month change for indexes whose October 2025 observations were unavailable.
The release was published on November 10. This explanation was prepared on November 18 and concerns that specific archived release. It does not substitute a later estimate for an official observation or claim that a particular stock-market session was caused by the inflation figures.
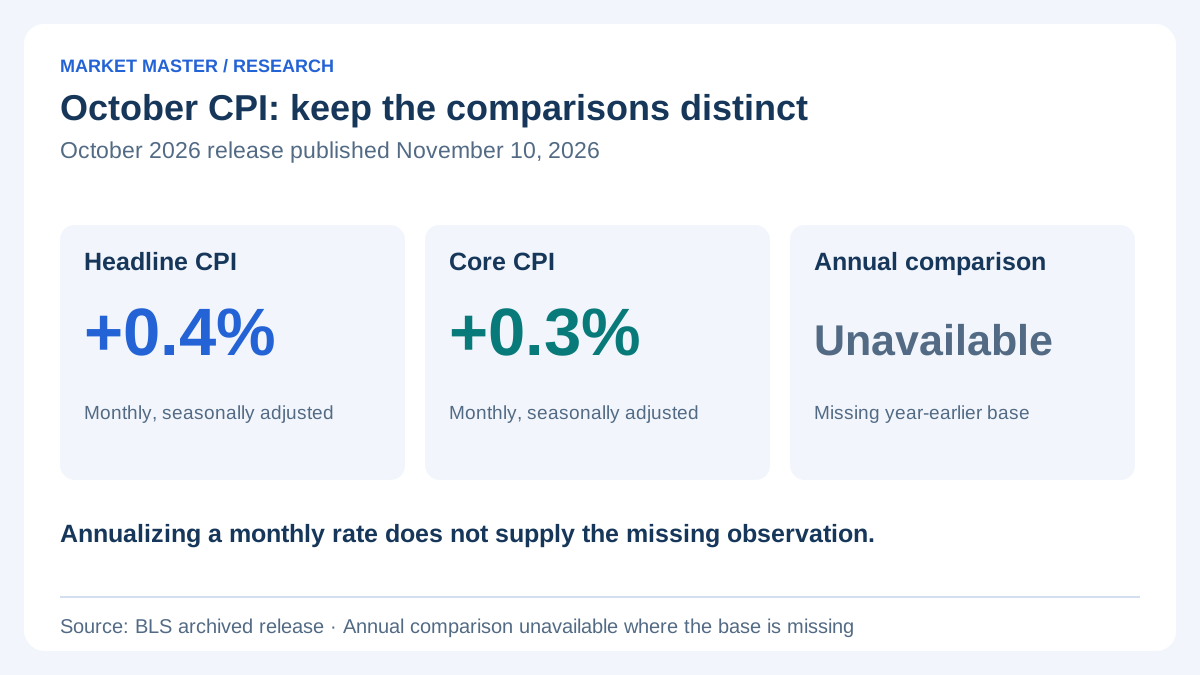
Three numbers, three different questions
| Measure | Reported reading | Comparison |
|---|---|---|
| All items, seasonally adjusted | +0.4% | September to October 2026 |
| All items less food and energy, seasonally adjusted | +0.3% | September to October 2026 |
| All items, before seasonal adjustment | +0.2% | September to October 2026 |
| Twelve-month comparison where October 2025 is missing | Not published | October 2025 to October 2026 |
The adjusted and unadjusted monthly readings are not conflicting answers. Seasonal adjustment addresses recurring calendar patterns; the unadjusted index records a different comparison. Before connecting either number with a market reaction, keep the series, adjustment and interval attached to the figure.
Why a slower monthly increase does not mean lower prices
The reported headline monthly increase slowed from September’s 0.6% to October’s 0.4%. That means the measured index still rose, but by a smaller monthly percentage. It does not mean the index fell by 0.2%, nor does it establish a broad decline in household costs. The difference between those monthly rates is 0.2 percentage points.
A fictional index makes the distinction visible. Start at 100, increase it by 0.6% to 100.6, then increase that result by 0.4% to 101.0024. The second increase is smaller, yet the ending level is above both earlier levels. This illustration explains the arithmetic; it does not reconstruct the official CPI index or a particular household’s spending basket.
Annualizing October cannot restore the missing comparison
If a hypothetical index rose exactly 0.4% in every month for twelve months, its compounded increase would be 1.004 to the twelfth power, minus one: approximately 4.91%. That is a conditional annualization of a rounded monthly rate. It is not the reported twelve-month inflation rate, and it is not a forecast that the same monthly increase will continue.
The distinction matters especially here. An observed twelve-month change requires compatible index levels at the beginning and end of that interval. Repeating one month twelve times supplies an assumption, not the missing year-earlier observation. Labelling the result simply “annual inflation” would make the article look more complete while changing what the number means.
The missing-data note is part of the release
BLS explains that October 2025 indexes could not be published because of the 2025 lapse in appropriations. Its separate guidance discusses approximating missing data points, while making clear that calculated substitutes and percentage changes based on them are unofficial. A reader’s private estimate therefore needs an explicit method and label; it should not be inserted into a table of official observations.
For this edition, the cleaner choice is to retain the missing value. A blank or “not published” entry preserves an important limitation. Zero would instead claim that no change occurred, which is a substantive and unsupported statement.
How to connect the release with market research
First record the publication timestamp and the exact series. Next, separate the new monthly observation from any forecast comparison; do not write “above expectations” without an identified, dated consensus source. Then inspect what actually happened in the relevant price window. A daily close combines developments before and after the release and cannot isolate an inflation surprise on its own.
Finally, write down alternative explanations and the next evidence to examine. Interest-rate expectations, company news and positioning can coexist with the inflation release. This framework makes the market observations easier to investigate without treating chronological proximity as proof of causation.
A reusable release-reading checklist
- Record the observation month and publication date separately.
- Label monthly versus annual comparisons and seasonal adjustment.
- Read missing-data and revision notes before filling a summary table.
- Keep reported values, estimates and conditional calculations in separate rows.
- Link the archived release so readers can reproduce the check after the next edition replaces the current-release page.
The same discipline applies to employment releases and national accounts. A carefully described limitation is more useful than a confident number answering a different question.
References and method
Use the references to check the factual explanations. Calculations and interpretations are Market Master’s own unless attributed otherwise. The assumptions and limits are stated alongside the relevant example.
Supporting references (2)
BLS October 2026 CPI archived release ↗www.bls.gov
BLS guidance on approximating missing data ↗www.bls.gov
Published by Market Master, an owner-operated publication led by Andrejus S. Editorial responsibility and production methods · Report a correction.