

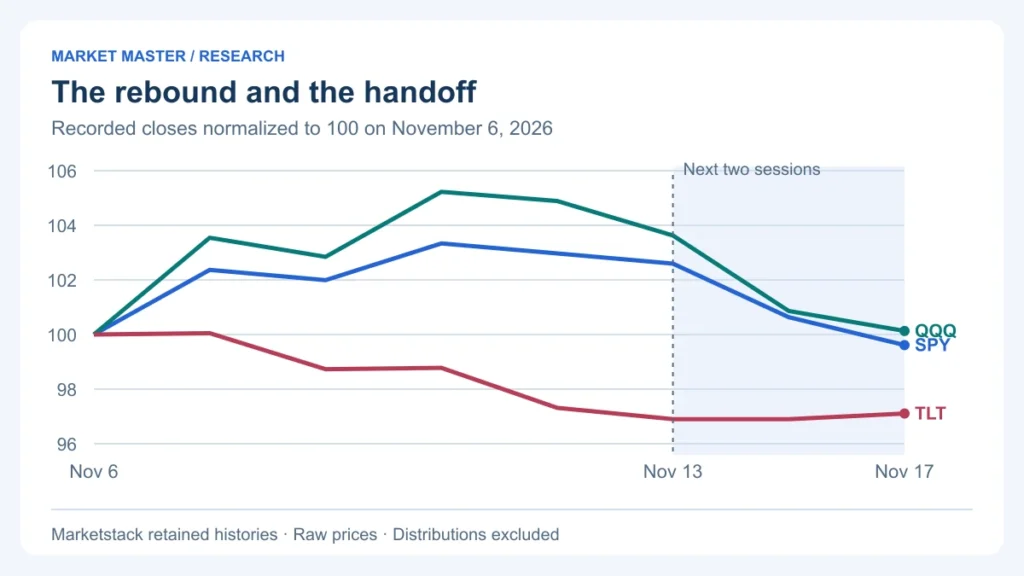
The week ended November 13, 2026 looked stronger for the two equity funds in this comparison. SPY gained 2.59% from the November 6 close and QQQ gained 3.63%. By the November 17 close, however, most of that rise had disappeared. SPY stood 0.39% below its November 6 close; QQQ was only 0.13% above it. A positive weekly result and a weak subsequent handoff can both be true.
This first Market Anatomy edition separates those windows. It is a retrospective study using completed sessions through November 17, prepared on November 18. It was not a forecast issued before the reversal. The figures are raw USD closing-price changes from the retained Marketstack histories, with distributions excluded.
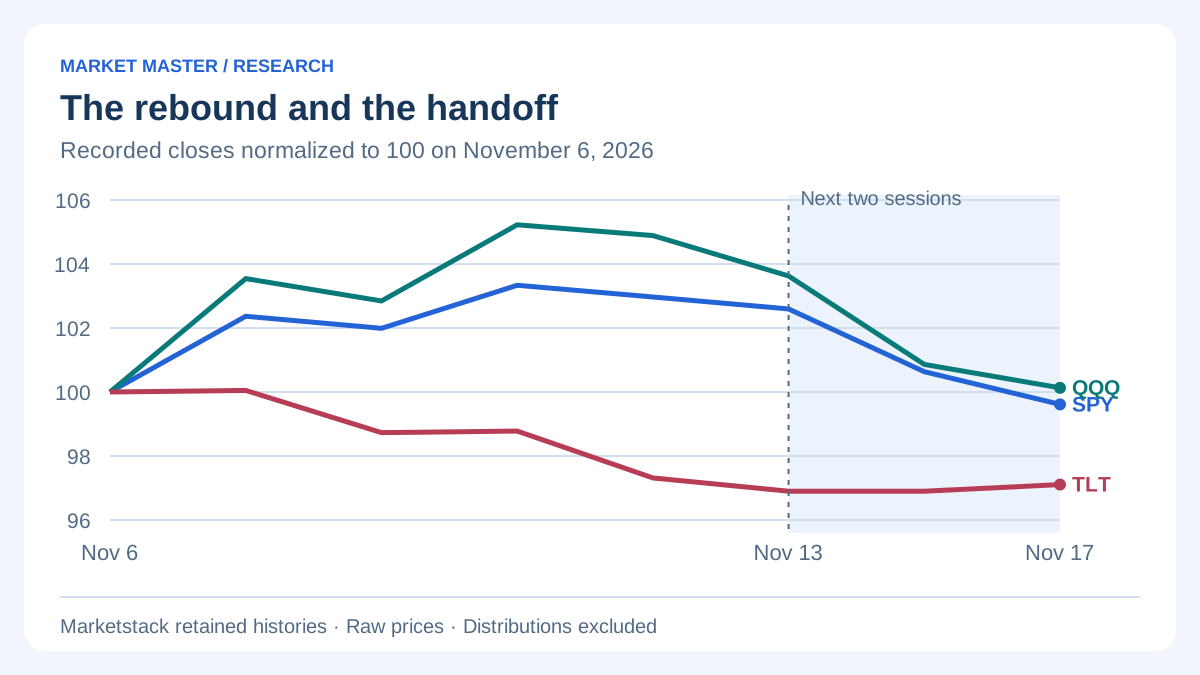
Start with two windows, not one headline
| Instrument | Nov 6 | Nov 13 | Nov 17 | Nov 6–13 | Nov 13–17 |
|---|---|---|---|---|---|
| SPY | 735.29 | 754.37 | 732.44 | +2.59% | −2.91% |
| QQQ | 656.10 | 679.89 | 656.95 | +3.63% | −3.37% |
| AAPL | 342.37 | 356.27 | 351.91 | +4.06% | −1.22% |
| MSFT | 530.61 | 523.88 | 506.24 | −1.27% | −3.37% |
| TLT | 81.92 | 79.38 | 79.55 | −3.10% | +0.21% |
For each interval, divide its ending close by its starting close, subtract one and multiply by 100. Do not add the two rounded percentage changes to estimate the full period. For SPY, the full comparison is 732.44 divided by 735.29, minus one: approximately −0.39%. The second decline acts on a different starting balance from the first rise.
The company readings resist a simple technology story
Apple rose during the first window while Microsoft fell. Their subsequent declines also differed. That matters because an explanation based only on QQQ’s weekly rise would flatten two different company observations into one narrative. The fund and the stocks have different exposures and weights. This small set cannot establish how every technology company performed.
A useful research question is therefore whether the fund-level strength was persistent and widely shared within the exposures we can actually measure. It is not enough to label the entire market optimistic because one concentrated fund advanced. Company disclosures, earnings dates and other developments need their own dated evidence before they can support a proposed explanation.
Sector funds broaden the comparison, with a defined denominator
Nine sector ETF histories had matching, validated USD observations for both windows. All nine rose between November 6 and 13; all nine fell between November 13 and 17. Energy’s XLE gained 5.42% during the first window, compared with technology’s XLK at 3.36%. During the second window, XLK fell 4.12%, while healthcare’s XLV fell 1.91%.
That is a count of nine sector funds, not a count of advancing stocks. XLP and XLI are excluded because usable validated histories were unavailable. The remaining funds are not equally important in the broad index, and different constituent weights can affect the comparison. Our conclusion is limited to the observed sample: the later weakness was present across those nine fund readings, rather than confined to QQQ.
A cross-asset check adds another question
TLT declined during the first window and recovered only slightly during the next two sessions. Its November 17 price was still 2.89% below November 6. That does not, by itself, tell us how the ten-year Treasury yield changed. TLT is a traded long-duration bond fund with its own holdings, distributions and price dynamics. Comparing it with equities is useful; relabelling its price return as a yield move would be a different and unsupported calculation.
Following the evidence: the next recorded check
Baseline recorded November 18; observations through November 17. The weekly rebound did not persist through the next two sessions in SPY and QQQ. The available sector sample also weakened. This is an observation about a completed window, not an assigned probability for the next one.
At the next completed weekly review, compare the same instruments and definitions. Record whether SPY and QQQ are above or below their November 17 closes, how many of the same nine sector funds advance, and whether the company readings remain divergent. A recovery in one fund alone would provide narrower evidence than a recovery shared across the measured sample.
Later observations belong in dated additions below this baseline. They should not silently replace it. If a source correction changes a price or a corporate action makes the interval misleading, explain the correction and recalculate the affected comparisons. The price-history comparison guide explains why dates and conventions come before interpretation.
Reproduce the comparison
Use the dated histories for SPY and QQQ, and the market terminal for the other observations. Our normalized chart divides each recorded close by that instrument’s November 6 close and multiplies by 100. It does not adjust for distributions, taxes, trading costs or investor cash flows.
References and method
Use the references to check the factual explanations. Calculations and interpretations are Market Master’s own unless attributed otherwise. The assumptions and limits are stated alongside the relevant example.
Supporting references (4)
Marketstack documentation ↗marketstack.com
SPY retained Marketstack history ↗marketmaster.com
QQQ retained Marketstack history ↗marketmaster.com
Market terminal and sector histories ↗marketmaster.com
Published by Market Master, an owner-operated publication led by Andrejus S. Editorial responsibility and production methods · Report a correction.