

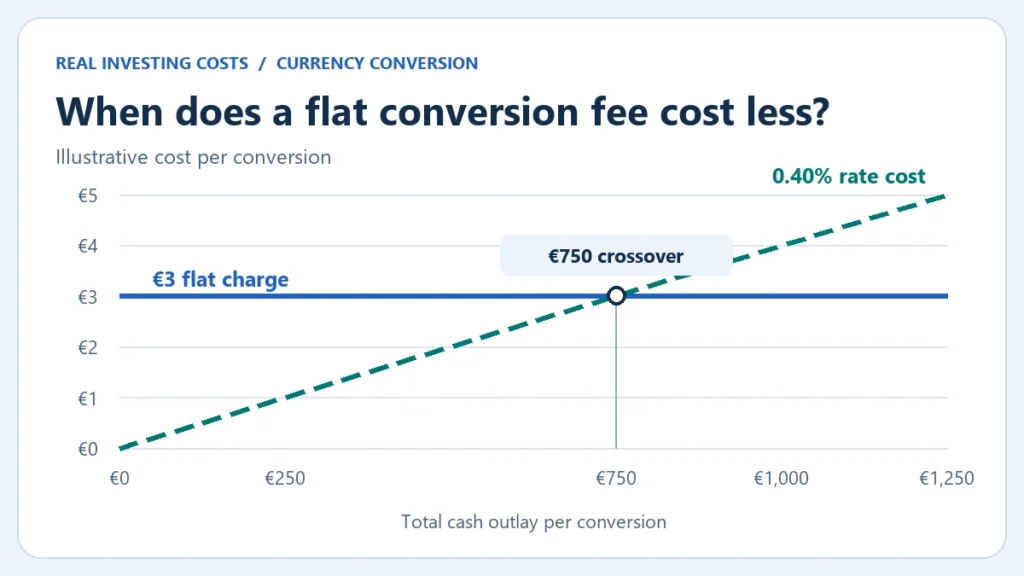
A €3 conversion charge costs 1.20% of a €250 contribution and 0.30% of a €1,000 contribution. A conversion quote that costs 0.40% works the other way around in this example. It costs less on the smaller transfer and more on the larger one. Compare the amount that actually reaches the investment account, using the same currency pair, time and total cash outlay. If you will convert the proceeds again, price that as a separate transaction. SEC investor bulletin on international investing
Start with the money that arrives
Imagine you have €250 to convert to U.S. dollars. A reference quote at the same time shows $1.1000 per euro. At that reference rate, €250 is worth $275.00. The reference is a measuring point. A broker may offer a different executable rate, and your actual statement may record a separate commission or fee. Hold the quote direction constant by writing both rates as U.S. dollars per euro. SEC explanation of exchange-rate quotes, spreads and commissions
- Example A charges €3 and uses the reference rate. If €250 is your total outlay, the charge leaves €247 to convert. The account receives $271.70. The $3.30 gap from $275.00 is €3.00 at the reference rate.
- Example B charges no separate fee and quotes $1.0956 per euro. The account receives $273.90 for your €250. The $1.10 gap from $275.00 is €1.00 at the reference rate. That is 0.40% of the €250 outlay.
These quotes are hypothetical. For an actual conversion, start with the cash removed from your account and the net value credited in the other currency. The estimated cost in euros is the euro outlay minus the net dollars received divided by the reference dollars-per-euro rate. If the commission was already taken out of what arrived, this calculation includes it. Record a same-time reference and note its source. A different timestamp can make an ordinary market move look like an extra fee.
Find where a flat charge and a percentage cost cross
With the assumed €3 flat charge and 0.40% rate cost, both examples cost the same at €750, because €3 ÷ 0.004 = €750. This crossover applies only to the two simplified schedules described here. If a fee schedule includes a minimum, a separate markup or tiered rates, build the comparison from actual amounts on either side of those thresholds.
| Total outlay per conversion | A · flat charge | B · rate cost | A over 12 identical conversions | B over 12 identical conversions |
|---|---|---|---|---|
| €250 | €3.00 | €1.00 | €36.00 | €12.00 |
| €750 | €3.00 | €3.00 | €36.00 | €36.00 |
| €1,000 | €3.00 | €4.00 | €36.00 | €48.00 |
At €250 per month the simplified schedules differ by €24 across the year. Compare that amount with the consequences of any change to when you invest. For example, four €750 conversions at the flat charge total €12, compared with €36 for twelve €250 conversions. If accumulating cash is how you reach €750, you may be delaying the purchase, earning a different yield on the uninvested balance, or taking a different currency exposure before investing. The table measures conversion cost alone.
Price the exit and distributions separately
Suppose a later sale leaves $3,300 available to convert back to euros. At a reference of $1.10 per euro, the proceeds have a reference value of €3,000. If that reverse conversion costs 0.40% of the reference value, €2,988 arrives and the cost is €12. This is a separate illustration. Actual sale proceeds, exchange rates and which charges apply can all change. Some accounts allow you to hold the foreign currency or reinvest cash distributions in that currency. Check whether an account converts sale proceeds or distributions automatically before projecting how often you will pay the charge.
Where the estimate can fail
The currency of a fund’s listing determines how you pay for that trade. The fund’s holdings and hedging policy determine the currency exposure you own. A euro trading line may avoid an account-level currency conversion for the purchase while the portfolio itself remains exposed to other currencies. Read the fund documents for the specific share class and the broker’s terms for conversion and settlement.
Before comparing quotes, record the side of the conversion, the timestamp, total cash debited, net cash credited, separately billed charges and the number of times the conversion would occur. Keep the fund’s expense ratio, the ETF’s spread and any known tax cost in their own rows. If currency conversion is part of a specific fund switch, use your one-time conversion estimate alongside the other switching costs in the existing worksheet. ETF switching-cost worksheet
References and method
Use the references to check the factual explanations. Calculations and interpretations are Market Master’s own unless attributed otherwise. The assumptions and limits are stated alongside the relevant example.
Supporting references (2)
SEC investor bulletin on international investing ↗www.investor.gov
SEC discussion of currency quote spreads and commissions ↗www.investor.gov
Published by Market Master, an owner-operated publication led by Andrejus S. Editorial responsibility and production methods · Report a correction.