

A corporate-bond fund can lose value on a day when Treasury yields fall. Its holdings are exposed to the Treasury curve and to the extra yield investors demand to own corporate debt. When those two forces move in opposite directions, a Treasury chart tells only part of the story.
Separate the benchmark from the spread
In a simplified comparison, a corporate bond yielding 5.50% against a comparable Treasury at 4.00% has a spread of 1.50 percentage points, or 150 basis points. The comparison works best when the instruments have similar currency and interest-rate exposure. Maturity alone can mislead if the securities differ in their coupon payments or call features.
The spread can widen when investors demand more compensation for default, downgrade, or liquidity risk. It can also move as the composition of a fund changes. A quoted spread alone cannot tell you the probability of default or the income the investor will receive. The SEC’s discussion of bond and income fund risks distinguishes credit, interest-rate, and prepayment risk.
Work through a falling-rate, widening-spread shock
Assume a hypothetical $20,000 corporate-bond sleeve with rate duration of 5 and spread duration of 4. Rate duration measures sensitivity to a change in benchmark yields. Spread duration uses the same idea for a change in credit spreads. Use decimal changes in yield and treat the effects as additive for a first-order estimate.
| Change | Calculation | Approximate effect |
|---|---|---|
| Treasury yield falls 30 basis points | −5 × (−0.003) | +1.50%, or +$300 |
| Credit spread widens 80 basis points | −4 × 0.008 | −3.20%, or −$640 |
| Combined price effect | 1.50% − 3.20% | −1.70%, or −$340 |
In this model, a spread widening of 37.5 basis points would offset the assumed rate benefit. The estimate changes if the fund has less spread exposure or if the yield curve moves unevenly. FINRA’s duration explanation provides the foundation for the price-sensitivity calculation. The separate spread duration here is a stated hypothetical input.
What to check before using the result
- Read the latest dated fund factsheet for effective duration, credit-quality mix, sector concentration, and callable exposure. If spread duration is absent, leave it as an unknown or compare clearly labelled assumptions.
- Compare daily fund prices with distributions over the same dates before drawing a total-return conclusion. See why a fund’s yield and share price can move in opposite directions.
- Keep benchmark and spread inputs separate. A fund’s quoted yield may already reflect the spread. Applying an all-in duration to the full yield change and then subtracting a spread shock again would count credit twice.
This linear estimate ignores convexity, changes in cash flows, defaults, trading costs and portfolio turnover. A comparison based on one Treasury tenor also misses curve reshaping. Use the Scenario Studio methodology to see how a model turns an asset-group move into a weighted portfolio effect. Its preset cases do not estimate this fund’s spread duration.
Stress-test the credit exposure separately
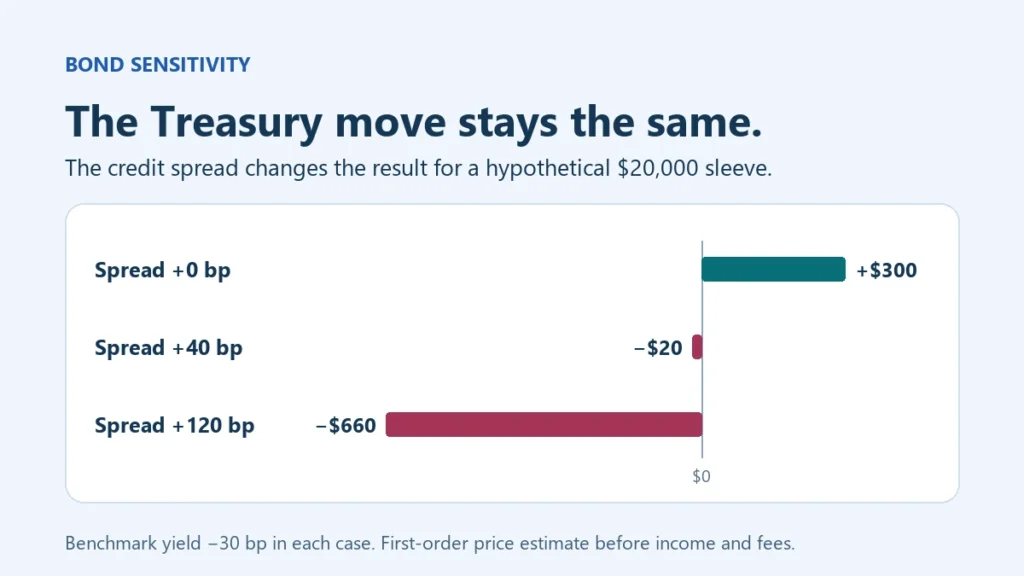
Keep the same $20,000 sleeve and assume that the Treasury yield falls by 30 basis points in three different cases. With spreads unchanged, the first-order gain is $300. If spreads widen by 40 basis points, the credit effect is −4 × 0.004 = −1.60%, or −$320, leaving a net loss of $20. If spreads widen 120 basis points, the credit effect is −4.80%, or −$960, leaving a net loss of $660. The direction of the Treasury move never changes. The amount of extra compensation demanded for credit explains the difference within the example.
For a portfolio-level check, suppose this corporate-bond sleeve is 20% of a $100,000 portfolio. The original scenario’s estimated −1.70% sleeve move contributes −0.34 percentage points to the portfolio before anything else moves. A separate Treasury sleeve could contribute positively, and other holdings could dominate the total. Write down each sleeve’s weight and its own shock before adding contributions. If you change the portfolio weights, rebuild that second calculation even if the assumed bond shocks stay the same.
When the actual fund factsheet provides only an effective duration, record which sensitivity is documented and which one you supplied as a scenario assumption. That distinction makes the result reproducible without presenting the assumed spread duration as a measurement.
References and method
Use the references to check the factual explanations. Calculations and interpretations are Market Master’s own unless attributed otherwise. The assumptions and limits are stated alongside the relevant example.
Supporting references (2)
SEC Investor.gov, Bond Funds and Income Funds ↗www.investor.gov
FINRA, Duration and interest-rate sensitivity ↗syndication.finra.org
Published by Market Master, an owner-operated publication led by Andrejus S. Editorial responsibility and production methods · Report a correction.