

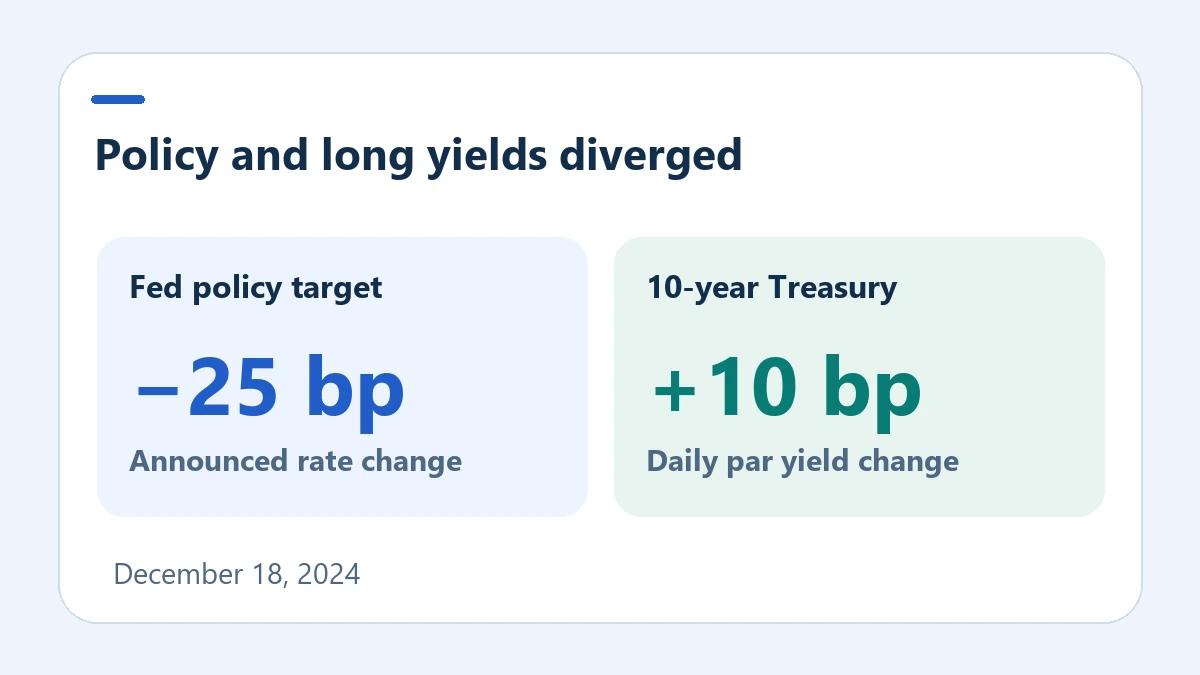
On December 18, 2024, the Federal Open Market Committee announced a quarter-point cut. The U.S. Treasury’s 10-year par yield was 10 basis points higher than the previous day. A useful post-mortem tests the idea that lower policy rates must immediately lift long-duration bond prices.
Establish the event and the measurement window
The FOMC statement was released at 2 p.m. Eastern time. It announced a new target range of 4.25% to 4.50%. The accompanying December projections put the median participant assessment for the end of 2025 at 3.9%, compared with 3.4% in the September projection column. Those are conditional participant assessments. The meeting minutes, released later, say markets had largely priced in the quarter-point move.
For the market side, use the Treasury’s daily nominal par yield curve. The observations come from indicative secondary-market bid quotations near 3:30 p.m. Eastern time. They are fitted yields for fixed maturities. The December 18 observation follows the statement, but the two-date comparison also captures everything else that happened between the observations.
| Tenor | December 17 | December 18 | Change |
|---|---|---|---|
| 3 months | 4.38% | 4.36% | −2 bp |
| 2 years | 4.25% | 4.35% | +10 bp |
| 10 years | 4.40% | 4.50% | +10 bp |
The 10-year minus 2-year slope stayed at +15 basis points. The 10-year minus 3-month spread rose from +2 to +14 basis points. A statement that the curve “steepened” is incomplete unless it names the two maturities.
Rebuild the assumption as a stress test
Assign a hypothetical Treasury sleeve a value of $25,000 and an effective duration of 7.8. Use the 10-year move as a small parallel-shock stand-in. Applying the duration approximation gives −7.8 × 0.001 = −0.78%, about −$195. At 25% of a hypothetical portfolio, the sleeve contributes about −0.195 percentage points to the portfolio move before accounting for the other assets.
For a counterfactual, enter −0.0025 as the assumed yield change. That gives +1.95%, or +$487.50 for the same sleeve. That scenario shows what the original assumption implied. It would have been an error to substitute the policy cut for the observed 10-year move. The Scenario Studio methodology uses the same allocation-times-shock step. The shocks in this article are entered in the arithmetic above because the Studio uses its own preset environments.
How to review the decision
Keep three lines in the record: the policy move announced, the market yield and observation time actually used, and the untested explanation for the move. Compare an intermediate and a long tenor before assuming a parallel shock. A particular bond or fund could behave differently because of duration, convexity, distributions, credit spreads, trading hours or market price versus NAV. The model above estimates sensitivity. It does not reconstruct an actual security return or isolate the effect of the statement.
Record an alternative assumption before you compare the result
Start a small decision record with the date, the exposure you’re testing, and the exact observation that would count against the original assumption. For this case, a falling policy range and a rising 10-year yield were enough to reject a mechanical one-for-one link for the selected observation window. An analyst could then test whether the 2-year yield moved in the same direction. It did on these two dates, but the 3-month observation moved down. That gives a documented reason to compare several maturities before entering the same shock for every bond in a portfolio.
Run one additional sensitivity with the same $25,000 sleeve and 10-basis-point yield increase. A shorter effective duration of 3 would imply about −0.30%, or −$75. A duration of 10 would imply about −1.00%, or −$250. The $175 difference comes from the choice of exposure while the observed yield change is held fixed. The two recalculations can be reproduced without estimating a policy surprise or borrowing a specific fund’s return series.
Retain the timestamp and units beside those results. If the research question changes to the effect of the announcement itself, the inputs would have to change too. That investigation would need time-stamped market observations around the release and a way to account for concurrent information.
References and method
Use the references to check the factual explanations. Calculations and interpretations are Market Master’s own unless attributed otherwise. The assumptions and limits are stated alongside the relevant example.
Supporting references (5)
Federal Reserve Board, December 18, 2024 FOMC statement ↗www.federalreserve.gov
Federal Reserve Board, December 2024 projections and September comparison ↗www.federalreserve.gov
Federal Reserve Board, December 17–18, 2024 meeting minutes ↗www.federalreserve.gov
U.S. Treasury, 2024 Daily Treasury Par Yield Curve Rates ↗home.treasury.gov
FINRA, Duration and interest-rate sensitivity ↗syndication.finra.org
Published by Market Master, an owner-operated publication led by Andrejus S. Editorial responsibility and production methods · Report a correction.