

If you need to inspect one ETF and switch timeframes, start with the public chart. In our November 21 signed-out test, TradingView opened the U.S.-listed TLT chart and switched from daily to weekly. Adding SPY to the same percentage scale prompted free-account registration. If you need a spreadsheet, check export availability on the plan you are considering before paying.
Which tool fits the job?
| Task | Where to start | What to verify |
|---|---|---|
| See how TLT moved over several weeks | TradingView’s public chart | Select the correct listing and confirm that the chart uses a weekly interval. |
| Compare TLT and SPY over the same window | TradingView’s percentage comparison | The signed-out flow asked for a free account. Record the first and last dates and check the dividend-adjustment setting. |
| Compare SPY and QQQ without signing in | Market Master’s Market Terminal | A November 22 signed-out test matched both funds to the same visible dates. The chart uses adjusted closes. |
| Download a picture of the SPY chart | Market Master’s Market Terminal | The signed-out download produced a 1,600 × 760 PNG. Use a data export for spreadsheet analysis. |
| Reconcile a fund’s quoted price change with its distribution | Market Master’s December 2024 Treasury ETF case | The worked example separates closing prices, cash distributions, and the effect of each on a 100-share position. |
| Compare a lower annual ETF fee with the cost of switching | Market Master’s switching-cost worksheet | Enter estimated costs for both trades and any upfront tax estimate separately. |
Market Terminal · Treasury ETF case · ETF switching-cost worksheet
What worked without signing in
Two of the three tasks we tried worked signed out. We opened the intended TLT chart and changed its interval. The third task, adding the exchange-listed SPY on the same percentage scale, stopped at an account prompt. We excluded CSV export from the score because we did not complete an export. TradingView documents the CSV workflow and lists export among its Essential plan features. Confirm the relevant feature, data entitlements, and renewal price in the current plan table. TradingView chart-data export · TradingView plan comparison
Record the dates before comparing the lines
TradingView bases both percentage lines at zero using the first visible bar. Zooming or scrolling can change that starting point. Note the first and last observations when you record a comparison, and check the exchange and the price-adjustment convention for both symbols. A chart on a percentage scale still measures the series you selected. Use the fund’s distribution history or an appropriately adjusted series when you need an estimate that reflects cash distributions. TradingView comparison guide
Reproduce a two-fund chart in a spreadsheet
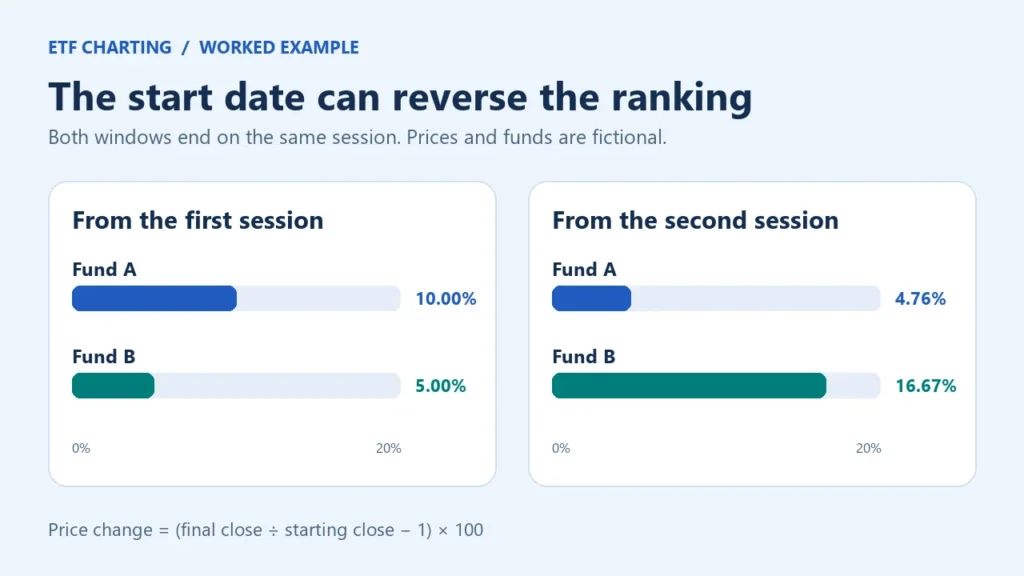
Use hypothetical closing prices to see what happens when the visible window changes. For each fund, divide its final close by its starting close, subtract 1, and format the result as a percentage. Both funds use the same pair of sessions.
| Fictional fund | First session | Second session | Final session | Move from first session | Move from second session |
|---|---|---|---|---|---|
| Fund A | $100 | $105 | $110 | +10.00% | +4.76% |
| Fund B | $200 | $180 | $210 | +5.00% | +16.67% |
Fund A leads over the full window. Fund B leads when you start at the second session, after its early decline. If a screenshot suggests one fund consistently outperformed the other, verify the dates before using it in a research note. These example prices exclude distributions. The Treasury ETF case shows how a cash distribution changes the interpretation of a real price comparison.
Decide whether a paid feature solves a recurring task
Write down the feature you would use each week, such as exporting a fixed window of daily observations. Verify it for the exact symbols you follow, including any required data subscription. Reproduce the task once at the tier you plan to use. The signed-out results above reflect chart access in one browser session. They do not score broker execution, returns, or every feature in any paid plan.
References and method
Use the references to check the factual explanations. Calculations and interpretations are Market Master’s own unless attributed otherwise. The assumptions and limits are stated alongside the relevant example.
Supporting references (3)
TradingView same-percentage comparison ↗www.tradingview.com
TradingView chart-data export ↗www.tradingview.com
TradingView current plan comparison ↗www.tradingview.com
Published by Market Master, an owner-operated publication led by Andrejus S. Editorial responsibility and production methods · Report a correction.