

A dividend yield is a price based ratio, not a measure of how easily a business can maintain its payment. The more useful question is what cash supports the dividend after the business has met its operating and investment needs. Earnings, operating cash flow and cash available after capital expenditure can tell different stories.
The company in this case is fictional. All amounts are annual and in millions of dollars unless stated otherwise. The example does not identify a safe dividend, estimate a real company’s future payment or recommend an income investment. It supplies a transparent bridge from a cash flow statement to a set of questions worth investigating.
Reconcile the base year
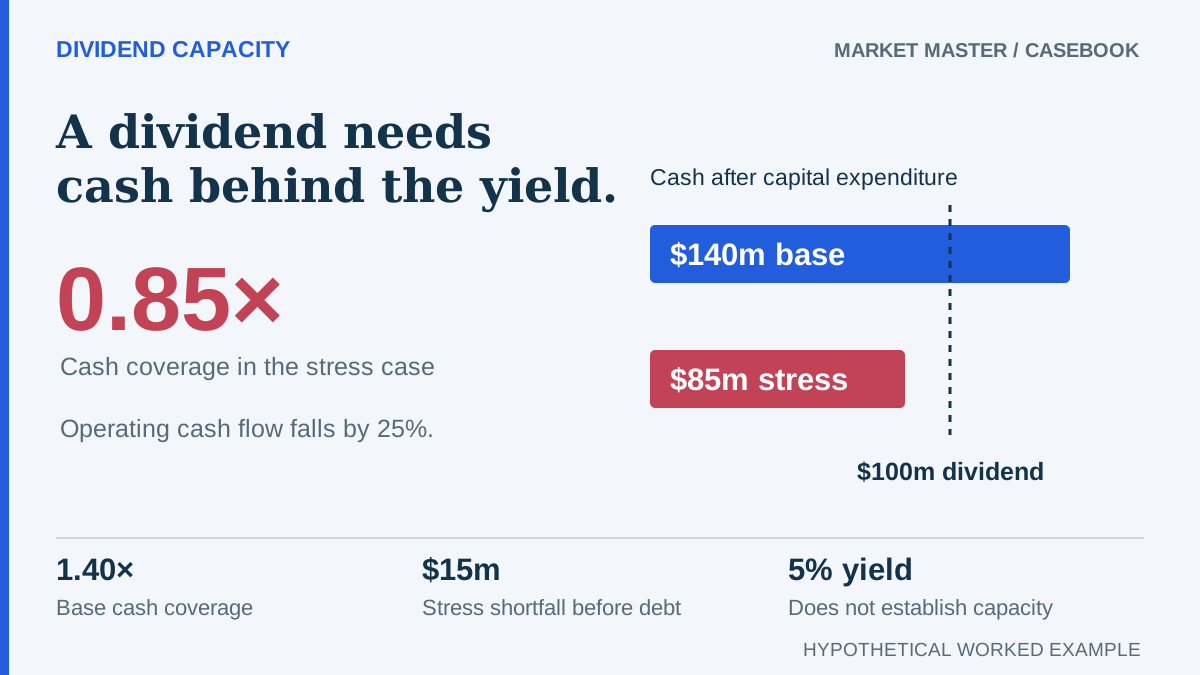
Assume the company reports $180 million of net income, $220 million of operating cash flow, $80 million of capital expenditure and $100 million of cash dividends. A simple cash after capital expenditure measure is $140 million. Relative to the dividend, that gives 1.4 times coverage and $40 million remaining before other uses of cash.
The earnings payout ratio is $100 million divided by $180 million, or approximately 55.56%. The dividend consumes about 71.43% of the simplified $140 million cash after capital expenditure measure. These ratios are not contradictory. They have different denominators, and neither should be described as the whole answer.
Operating cash flow is not automatically discretionary cash. Capital expenditure can be necessary to maintain the business, and the statement may include temporary working capital benefits. A definition called free cash flow should be written down rather than assumed to be identical across companies or data vendors.
Introduce a weaker operating year
Reduce operating cash flow by 25%, from $220 million to $165 million, while retaining $80 million of capital expenditure and the $100 million dividend. Cash after capital expenditure falls to $85 million. Coverage becomes 0.85 times, creating a $15 million shortfall before other cash needs.
The company might use existing cash, borrow, sell assets, change investment plans or reduce the dividend. This case does not predict which action management would take. The stress test identifies that the base year margin is not sufficient under the stated weaker cash assumption.
Do not claim that a 25% reduction is the worst plausible year or assign it a probability without evidence. It is a scenario chosen to test dependence on operating cash generation. A business with highly variable cash flows may require a wider set of cases and a review of several reporting periods.
Add competing claims on cash
Suppose $30 million of debt principal also falls due during the year. In the base case, the $40 million remaining after capital spending and dividends would fall to $10 million after that repayment. In the stressed case, the total funding gap would widen from $15 million to $45 million if the debt is repaid from the same year’s cash.
Interest already included in operating cash flow under the reporting convention must not be deducted again. Principal repayment and interest are different items. Lease payments, acquisitions, share repurchases and restricted cash can also affect the interpretation, depending on the company and accounting framework.
This is why a dividend screen that uses only net income can miss a meaningful constraint. It is also why a simple cash coverage ratio cannot replace an examination of financing arrangements and the business’s actual investment requirements.
Distinguish maintenance and growth spending carefully
Management may describe part of capital expenditure as growth investment and suggest it could be reduced. That distinction can be useful, but it should not be accepted without examining what would happen to operations if the spending stopped. Some expenditure labeled growth may still be important to future competitiveness or contracted commitments.
Test both the reported total and any adjusted definition you consider. Keep the adjustment visible. Reducing capital spending in a spreadsheet merely to restore dividend coverage can produce a reassuring answer without establishing that the real business has that flexibility.
Separate yield from payment capacity
Assume the fictional company pays $2 a share and trades at $40. Its indicated yield is 5%. If the share price falls to $30 while the stated annual payment remains $2, the indicated yield rises to about 6.67%. The price decline did not itself create additional cash to fund the dividend.
A rising yield can therefore reflect a falling price rather than an improving payment. The dividend may later change. Verify whether the quoted yield uses past payments, an annualized recent payment or a forecast, and do not mix those definitions when comparing investments.
Keep the bridge attached to the evidence
Use the dividend income guide for the broader assessment and the valuation lab to test explicitly stated cash flow assumptions. A loaded dataset does not replace checking the filing’s reporting period, currency, units and definitions.
Retain the operating cash flow, capital expenditure, dividend cash amount, debt needs and each adjustment in a simple record. State what evidence would change the conclusion. The goal is to understand which cash sources support a payment and where the margin disappears, rather than treating a yield or a coverage multiple as a promise that income will continue.
References and method
This worked case uses fictional inputs. Its arithmetic illustrates the assumptions stated in the article; the references explain the underlying concepts.
Supporting references (2)
SEC: Beginners Guide to Financial Statements ↗www.sec.gov
SEC: Stocks ↗www.investor.gov
Published by Market Master, an owner-operated publication led by Andrejus S. Editorial responsibility and production methods · Report a correction.